Designing data clarity for renewable risk management
2023
Renewable Energy ∙ Data Visualisation
Summary
In 2023, I partnered with a renewable energy organisation to redesign their risk management process for distributed renewable energy assets. The goal was to create a unified platform that would streamline workflows, eliminate fragmentation, and elevate how data was visualised, interpreted, and acted upon across the organisation.
The platform has since replaced five legacy tools and is now used across 350+ global renewable energy sites, empowering teams to make faster, more informed decisions through well-designed, actionable data visualisation.
Challenge
From data overload to insight
The client manages cloud-based control of renewable energy assets like wind and solar farms, using AI to balance supply and demand. However, their internal risk processes hadn’t caught up: data was scattered, visuals were inconsistent, and decision-makers had no clear window into overall risk.
Key challenges
- Asset Managers wasting hours navigating siloed tools and spreadsheets
- No standardised risk taxonomy or consistent visual reporting
- Slow, manual reporting processes prone to inconsistency
- Inability to surface key insights quickly or intuitively
The business imperative was clear: consolidate risk-related data into a single platform with intelligent visualisation and seamless workflows.
Discovery & research
The client provided a foundation of usage data, which I analysed to identify usage patterns and drop-off points. To contextualise the numbers, I led qualitative research including:
- 1:1 stakeholder interviews
- Card sorting to align on terminology
- A gap analysis of all five existing tools
Persona development was data-driven, resulting in four key user groups with distinct needs around data consumption and reporting:
- Directors needed high-level dashboards with exportable reports
- Asset Managers required visual alerts, trends, and drill-down views
- Operations Managers looked for visibility across sites and users
- Field Operatives needed mobile-friendly forms with minimal visual clutter
One critical insight emerged: users weren’t lacking data—they lacked context and clarity. They didn’t just need to track incidents; they needed the right information, surfaced at the right time through effective visual cues.
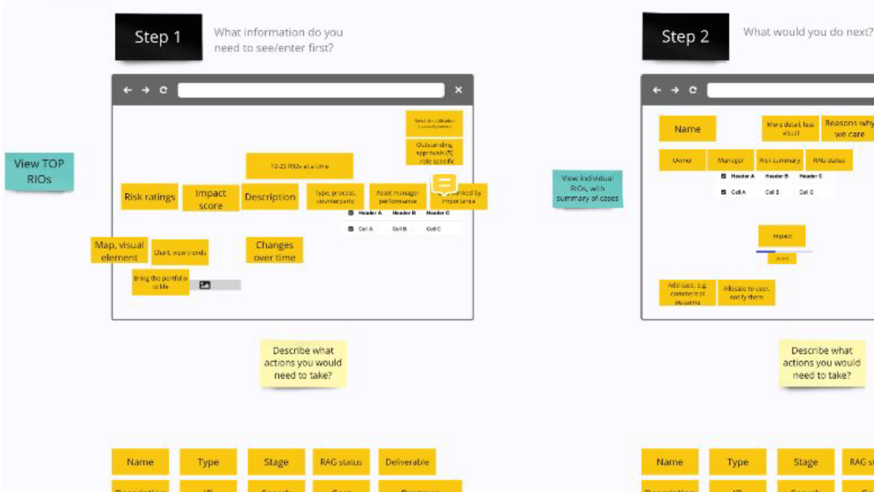
Designing visual intelligence
Our ideation focused on turning complex risk data into intuitive visual stories. In co-creation workshops with stakeholders, we explored dashboard concepts that surfaced patterns, anomalies, and priorities without overwhelming the user.
Key design goals
- Establish a unified visual hierarchy to reduce cognitive load
- Use colour, icons, and layout to flag severity and urgency
- Enable drill-downs from summary views to raw data
- Ensure reports were exportable and presentation-ready
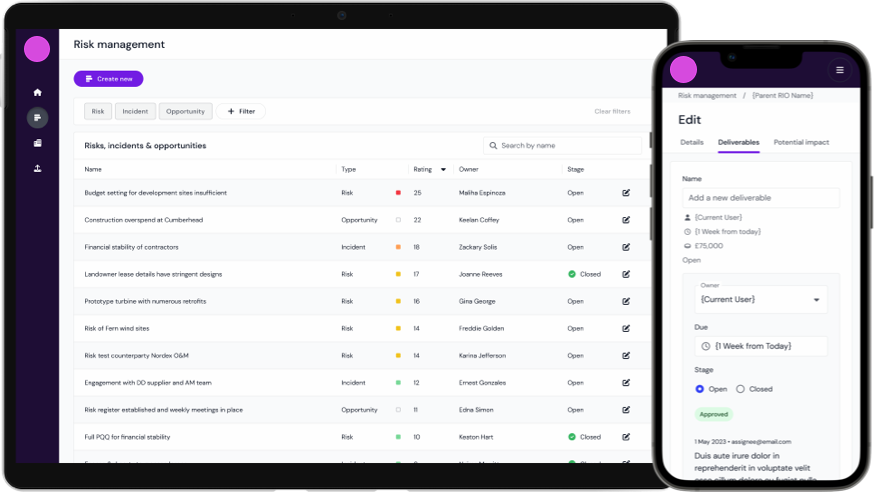
From sketch to system
We moved from rapid sketching to mid- and high-fidelity prototypes. I contributed new components to the organisation’s design system to support data-heavy layouts, including:
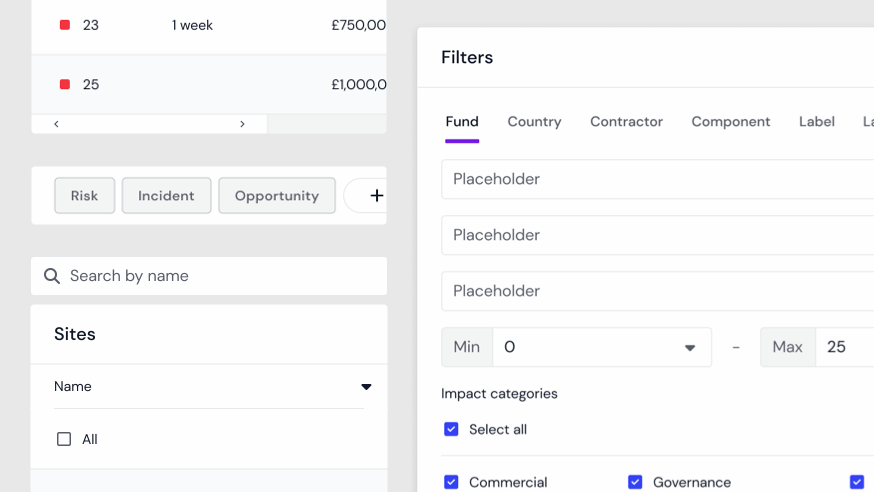
- Risk heatmaps with interactive filters
- Timeline views for incidents and resolutions
- Severity badges and dynamic labels
I also applied accessibility standards (GDS, WCAG 2.1) to all visual elements, using tools to ensure charts, colours, and UI states were inclusive.
Usability testing & visual feedback
We tested the prototype with representatives from each persona, focusing heavily on how users interpreted and interacted with visual data. Testing sessions included tasks such as:
- Creating and assessing a risk using severity indicators
- Interpreting dashboard metrics and trend graphs
- Generating downloadable reports with visual summaries
Key findings included:
- Visual priority matters: Users expected critical risks to appear more prominently than they did. We revised the layout to support “at-a-glance” decisions.
- Familiarity bias: Some users initially resisted the dashboard format, preferring old spreadsheet views. But visualisation won over once they experienced faster insight.
- Validation helps: Visual feedback (e.g. risk severity sliders, form progress indicators) improved user confidence during complex inputs.
We applied findings into a new version, focusing on clarity, consistency, and faster interpretation. Post-test surveys showed a 40% improvement in perceived task speed and confidence.
Launch outcomes
The first MVP launched with Asset Managers as the primary focus. Over time, new features and roles were added, and the tool was adopted by hundreds of sites globally.
The platform helped users:
- Save time by reducing data entry and duplicate reporting
- Respond to incidents faster, thanks to clear prioritisation cues
- Gain a shared understanding of risk through standardised visual dashboards
The platform continues to evolve, with an average of two new features released per month — many related to data insight and automation.
Reflections
This project reinforced how vital it is to move beyond raw data and toward decision-ready design. Great visualisation isn’t decoration — it’s function. Especially in energy, where decisions carry operational and financial risk, clarity is critical.
Top lessons
- Invest early in defining visual language: icons, severity levels, and layout consistency helped unify how different teams understood risk.
- Simplicity scales: starting with a focused MVP for Asset Managers made it easier to expand to other personas without bloating the interface.
- Feedback loops matter: rapid testing cycles allowed users to co-own the visual logic, leading to higher trust in the tool.
Future opportunities
The next frontier is AI-assisted visualisation. With advancements in LLMs and predictive analytics, there’s an opportunity to surface emerging risks before they appear in the data — through proactive, explainable visuals.
Examples include:
- Generative summaries of risk clusters
- Visual forecasting of incident trends
- Natural language queries for on-demand reports
As the organisation continues this journey, the platform is well positioned as a scalable product where visual design meets operational intelligence.
Final thoughts
Designing the platform was a rich, rewarding challenge. The client brought a thoughtful, collaborative mindset that allowed our team to deliver lasting impact. For me, the project highlighted the power of UX to make data visible, actionable, and empowering — especially in mission-critical, data-dense industries like renewable energy.
Thank you for taking the time to read this case study. Let me know if you’d like to see more wireframes, user personas, or design recommendations from the project.